Try it yourself
The Spark
My son and I have been building Mark Rober’s CrunchLabs Build Boxes and they’re an absolute blast. For the uninitiated: Each month, Mark Rober and team introduce an engineering concept with a ~20 minute video.. and then you build something cool that demonstrates it hands-on. We just started Season 2, and the first box was all about the bell curve distribution – demonstrated with “Galton’s Goalie,” basically a desktop Plinko machine.
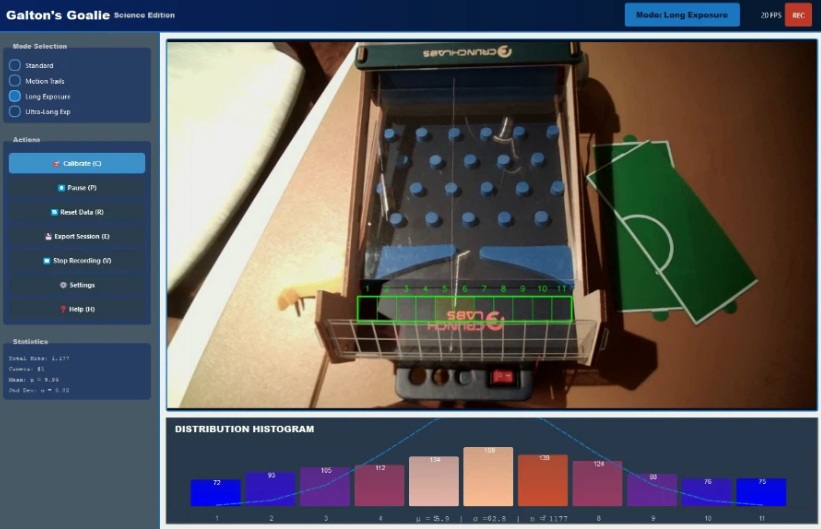
Watching the balls bounce randomly through the pegs and settle into a pretty decent bell curve distribution is mesmerizing. But somehow it wasn’t proving the point well enough for me.. and I couldn’t help thinking: what if we could actually VISUALIZE how it creates a bell curve? If we could get computer vision layered on top, we could track every ball and show the distribution in real-time.

My 2026 Wake-Up Call
This turned out to be my 2026 wake-up call – my “OMG I just did 3 months of work in a couple of hours” moment.
Back in the day, I built Still Life in Symphony – a signal processing engine with a computer vision component. We spent literally months building the foundations. Detecting motion, tracking objects, creating particle effect trails.
But here in 2026, I described the problem to Claude, we talked back and forth about the approach, and it baked the first working version in a matter of hours. Real-time ball detection. Histogram updates. Motion trails.
Then I showed it to a colleague who asked if we could improve the UI. One conversation with Claude later, we had a complete PyQt5 interface with multiple visualization modes, calibration controls, the works.

Why Not Both?!
With Still Life, adding a visualization mode (long exposure, particle effects, etc.) was a significant decision. We’re talking days of careful coding, testing, integration. You had to commit, then grind.
Now, when Claude would suggest a few different visualization options, I could say “why not both?!” and both would be cooked that afternoon. Long-exposure mode. Motion trails with colour cycling. Per-bucket sensitivity tuning. Make it so, my dude!
What used to take days now takes minutes. The limiting factor isn’t implementation, it’s the idea itself.
I’ve Done This Before – How Much Does That Matter?
With Symphony it took 3 months instead of 3 hours, but over those 3 months, I built up the vocabulary that is still somewhere in the back of my head, so I knew what questions to ask Claude, and have some intuition for what Computer Vision approaches would work when it gave options.
Regardless – apparently, you don’t need months of experience to build something like this anymore. Just curiosity, willingness to iterate, and the ability to recognize when something’s working (or not).
This was the project that inspired me to start this whole “Side Quests” series. If I can knock out a real-time computer vision app in an afternoon, what else becomes possible?
Try It Yourself
The full code is on GitHub: GaltonGoalieViz
Watch an earlier version in action on YouTube, or check out the sample videos showing the system tracking balls in real-time:
Mark and Team CrunchLabs, if you ever stumble across this, thanks for sharing the energy, spirit, and inspiration that (re)ignited this whole thing.