ZAMBESI: TESTING, ROUND 1
ZAMBESI: TESTING, ROUND 1
Robert Burke, 22 Apr/99
That's all great, but how does it perform?
After implementing Zambesi and reading about genetic algorithms, I was curious to find out whether or not I could "breed" more intelligent frosh for Legend of the Greasepole. A set of 85 randomly-generated Frosh that were created with the original Zambesi implementation could take anywhere up to three hours of game time to climb the Greasepole on a particularly bad trial.
In order to continue testing Zambesi, a number of modifications to Legend of the Greasepole’s code were necessary. First of all, a modification to the main code loop allowed the game to process the Artificial Intelligence of the Frosh at full speed, neglecting sound and graphics output. A three-hour greasepole climb could now be "run" in less than four minutes on a Pentium-II at 233MHz. In accordance with this change, all climb time scores in this document are reported in iterations. One iteration is 1/23rd of a second. Information about each trial is saved to the polegame.txt file in the Legend of the Greasepole directory. Here is sample output from an (exceptionally) good trial that took 11787 iterations (8.5 minutes game time!) :
Initializing Jacket Slam.
Initializing 'Menu' Bitmaps for TITLE screen.
Flushing Spritesets
Initializing Title Sprites
Initializing 'Game' Bitmaps
Flushing Spritesets
Initializing Game Sprites
A Frosh reaches the tam.
Pyramid failed because there were more frosh on level 4 than 3.
A Frosh reaches the tam.
A Frosh reaches the tam.
A Frosh reaches the tam.
Score:
11787Zambesi’s Roadster class was extended to include a system for saving and loading neural network weights. This serves as a rudimentary method for transferring weights between generations of Frosh. All Frosh have the same learning rate h within a generation; this learning rate could theoretically change from generation to generation, or even within the course of a greasepole climb. While we have provided no means for encoding the learning rate (or the structure of the neural network) within the genotype, these would be interesting venues for future research.
Round 1 Conclusions
Two millenia of Greasepole climbing later, I arrived at the same conclusion as Nolfi and Parisi in their article ‘Genotypes’ for Neural Networks. Frosh that began their lives with neural networks that had previously produced exceptional results were not particularly more prone towards additional rapid victories. Nolfi and Parisi went on to say that it was the ability to learn that improved a creature’s performance. It is unclear how we could test this in the context of the greasepit.
Passing information through genotypes
Consider the results of Trial 8D below, which was performed by first saving the weights for 250 generations of Frosh. Each group of 85 frosh simply inherited the weights of their 85 "parents." It would have been very difficult to isolate which Frosh in the pit are contributing the "most" to a successful Pole Climb, and so we did not employ a Natural Selection algorithm. For 8D, we took the weights of the Frosh that had the best pole climb time, and had those Frosh try to climb the pole an additional 48 times. Their average time – 31275 iterations, or just over 22 minutes game time – was impressive when compared to the averages across all trials. However, these results had a standard deviation of 25,978, and their climb times varied from 5,405 iterations (less than 4 minutes) to over 118,000 iterations (85 minutes). It would seem that "exceptional" groups of Frosh are also exceptionally volatile, and they can be easily influenced by random events that affect their climb.
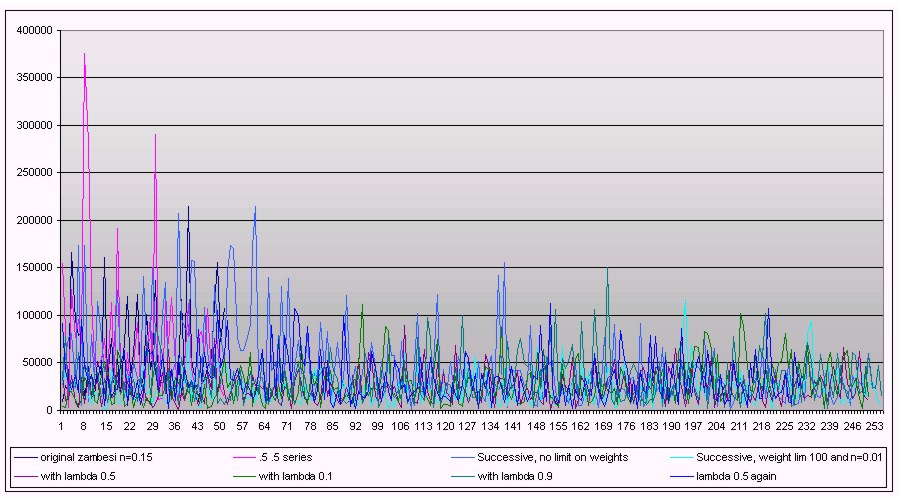
While maintaining neural weights from one generation to the next did produce better average climb times, this isn’t evident in the results of trial 9. Perhaps a more interesting way of observing the effect that passing information through generations had is Figure 1. This figure shows how the groups of Frosh tended to improve and decline in waves. It is possible that this is the result of the Frosh encoding "noise" in their weights (see Haykin, Chapter 4).
Zambesi as an Input-Output Model
Average pole-climb times for Frosh using the old system were considerably less than 30,000 iterations (6,900 iterations or 5 minutes of game time was common). These tests suggest that we have not provided our neural network with the inputs it would require to produce more effective outputs. Consider some of the relationships that it might be helpful for a neuron to be able to encode. For example, the reasoning, "there are two of us on this level, so I will support you, and you can climb up" is not a thought that would be possible within the context of the current neural network. The thought could be "hacked" if, due to randomness, one of the Frosh elected to climb up, and the other elected to stay put. But hinging such critical behavior on something so random seems inappropriate.
Zambesi as a Critic Model
The Zambesi Critic algorithm is too simple. Consider the situation where a Frosh is actively tearing on the Tam. From the moment the Frosh reaches the Greasepole until the moment the pyramid tumbles and is being rebuilt, every Frosh in the game is being told their behavior is producing failure. This is inane. Something needs to be done to reward the Frosh for stable pyramids that reach the tam.
The Legend of the Greasepole as a Learning Environment
Training 85 neural networks to create 85 characters that are meant to work in unison is a difficult and interesting challenge. I am adamant that there must be some way to train uberFrosh that perform better than the artificial intelligence I wrote for the release version of Legend of the Greasepole.
Postscript
An examination of the weights of higher-generation Frosh suggests that the high failure-to-success ratio in the pit produces Frosh with extremely negative neural weights. Research is continuing with new critic models and learning algorithms to prevent this.
Results Summary
Trial No. Description Num trials
Successive?
Starting weights
Max weight
h
l
Avg, all
Avg, last 50
1 Initial Trial with original Zambesi algorithm. 50
n
rnd(-1..1)
-
.15
-
60911
60911
2 Changed critic to include weighted average of past values. Performance degraded. 50
n
rnd(-1..1)
-
.15
-
78245
78245
3 First successive trial (weights passed between generations of Frosh) 250
y
rnd(-1..1)
-
.15
-
48056
26082
4 Pleased with result of successive trials, imposed a weight limit of 100 and reduced h to 0.01 250
y
rnd(-1..1)
100
.01
-
23243
27454
5 Associative Reward-Penalty with l =0.1 250
y
rnd(-1..1)
100
.15
0.1
27804
36758
6 Associative Reward-Penalty with l =0.9 250
y
rnd(-1..1)
100
.15
0.9
32129
33506
7A Switched to Associative Reward-Penalty algorithm with l =0.5. 250
y
rnd(-1..1)
100
.01
0.5
23562
23028
7B Associative Reward-Penalty with l =0.5 again. Note discrepancy with 5A. These weights were all saved, and weights from times when the trendline was lowest were used in trials 8A through 8D. ARP isn’t statistically an improvement. 250
y
rnd(-1..1)
100
.01
0.5
32952
28120
8A Initializing to the weights from Trial 16 of 7B 67
n
7B-16
100
.01
0.5
33964
-
8B Initializing to the weights from Trial 59 of 7B 46
n
7B-59
100
.01
0.5
34128
-
8C Initializing to the weights from Trial 89 of 7B 36
n
7B-89
100
.01
0.5
36125
-
8D Initializing to the weights from Trial 92 of 7B 48
n
7B-92
100
.01
0.5
31275
-
9A Again, a random-weight successive ASU trial 100
y
rnd(-1..1)
100
.01
-
48770
-
9B Same as 9A but non-successive. The results aren’t that much better, which provides insight into how useful a pre -learned genome is. 100
n
rnd(-1..1)
100
.01
-
51548
-
10A Successive trial with maxweight 1,000 83
y
rnd(-1..1)
1000
.01
-
49678
-
10B Successive trial with maxweight 10,000. The results of trial 10 are hardly stastistically significant, but they suggest that increasing maxweight has little effect. 32
y
rnd(-1..1)
10000
.01
-
76465
-
11A Exact same stats as Trial 4, different randomizer seed. Look at the discrepancy! 34
y
rnd(-1..1)
100
.01
-
66980
-
11B Lift h to 0.15 and see what happens. 50
y
rnd(-1..1)
100
.15
-
48342
-